Understanding the Wyckoff Accumulation Pattern in Algorithmic Trading
AndyVentura • 5/10/2025, 2:23:27 AM
Understanding the Wyckoff Accumulation Pattern in Algorithmic Trading
The Wyckoff Accumulation pattern is a foundational concept in technical analysis and trading, especially valuable for algorithmic traders seeking to identify potential market bottoms and favorable entry points. Developed by Richard D. Wyckoff in the early 20th century, this pattern helps traders understand the behavior of large professional operators, often referred to as “smart money,” as they accumulate shares quietly before a significant uptrend.
What is the Wyckoff Accumulation Pattern?
Wyckoff Accumulation is a phase in the market cycle where the price moves sideways after a downtrend, indicating that strong hands are buying and absorbing supply from weak holders. This phase typically precedes a bullish move, making it a critical signal for traders aiming to enter at low-risk points.
Unlike simple consolidation patterns, Wyckoff Accumulation is characterized by a series of price actions and volume behaviors that reveal the ongoing battle between supply and demand. Recognizing this pattern requires an understanding of its distinct phases and events.
The Structure of Wyckoff Accumulation
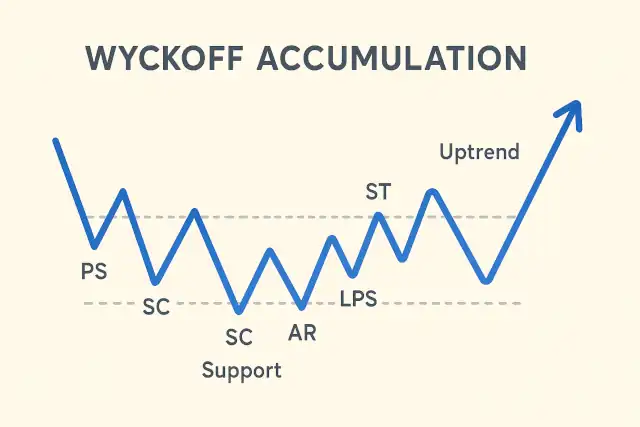
Wyckoff identified several key phases and events within the accumulation pattern:
1. Preliminary Support (PS)
This is where substantial buying begins to provide support after a prolonged downtrend. Increased volume may be observed as informed traders start accumulating.
2. Selling Climax (SC)
The point of maximum panic selling, often marked by a sharp price decline and a spike in volume. This represents the exhaustion of selling pressure.
3. Automatic Rally (AR)
Following the SC, prices rebound sharply due to the reduction in supply and some buying interest. This rally defines the upper boundary of the trading range.
4. Secondary Test (ST)
Price revisits the area of the selling climax to test the supply and demand balance at lower levels, usually on lower volume, confirming that selling pressure is waning.
5. Spring (or Shakeout)
A false breakout below the trading range designed to mislead traders into thinking the downtrend will continue. This move is often followed by a quick recovery, trapping bears and shaking out weak hands.
6. Sign of Strength (SOS)
A strong rally through resistance levels within the trading range, accompanied by increased volume, indicating that demand is dominating.
7. Last Point of Support (LPS)
The final low within the trading range, occurring on reduced volume, signaling that selling pressure is minimal and accumulation is near completion.
8. Breakout and Uptrend
The price breaks above the trading range with strong volume, confirming the end of accumulation and the start of a markup phase.
Why is the Wyckoff Accumulation Important for Algorithmic Trading?
Algorithmic trading strategies rely heavily on price patterns, volume analysis, and market psychology. The Wyckoff Accumulation pattern encapsulates all these elements, providing a robust framework for developing algorithms that can:
- Identify Market Bottoms: Algorithms can be programmed to detect the sequence of events in Wyckoff Accumulation, signaling a high-probability reversal zone.
- Optimize Entry Points: By recognizing phases such as the Spring or Last Point of Support, algorithms can enter positions with favorable risk-reward ratios.
- Manage Risk: Understanding volume patterns and price behavior helps algorithms avoid false breakouts and reduce exposure during uncertain phases.
Implementing Wyckoff Accumulation in Algorithmic Strategies
To incorporate the Wyckoff Accumulation pattern into a trading algorithm, consider the following steps:
1. Define the Trading Range
Identify the upper and lower boundaries of the sideways price action after a downtrend using historical price data.
2. Analyze Volume Patterns
Look for volume spikes during the Selling Climax and reduced volume during Secondary Tests. Volume analysis is crucial to confirm the pattern.
3. Detect Key Events
Program the algorithm to recognize price behaviors such as the Spring (false breakdown) and Sign of Strength (breakout with volume).
4. Entry and Exit Rules
Set rules for entering long positions near the Last Point of Support or immediately after the breakout above the trading range. Exits can be placed based on profit targets or signs of weakening demand.
5. Backtesting and Optimization
Test the algorithm on historical data to evaluate its performance and optimize parameters such as volume thresholds and price levels.
Mathematical Representation
While Wyckoff patterns are primarily qualitative, some quantitative measures can be used to enhance algorithmic detection:
- Volume Weighted Average Price (VWAP): Helps identify average price levels during accumulation.
- Volume Oscillators: Indicators like the On-Balance Volume (OBV) or Chaikin Money Flow (CMF) can highlight accumulation or distribution phases.
For example, an algorithm might trigger a buy signal when:
followed by a breakout with:
where is the Last Point of Support and is the Automatic Rally level.
Practical Tips for Traders
- Combine with Other Indicators: Use Wyckoff Accumulation alongside moving averages, RSI, or MACD to confirm signals.
- Use Multiple Timeframes: Analyze both daily and weekly charts to validate the pattern.
- Be Patient: Accumulation phases can last weeks or months; avoid premature entries.
- Watch Volume Closely: Volume is the key to confirming each phase of accumulation.
Conclusion
The Wyckoff Accumulation pattern offers a powerful lens through which algorithmic traders can view market behavior. By understanding the phases of accumulation and the underlying psychology of smart money, traders can develop algorithms that identify low-risk entry points and improve profitability.
Incorporating Wyckoff principles into algorithmic trading requires careful analysis of price action, volume, and pattern recognition. With proper implementation and testing, it can become a cornerstone strategy in an algorithmic trader’s toolkit, helping to navigate markets more effectively and capitalize on emerging uptrends.