How to Draw Proper Trendlines for Effective Trading Analysis
AndyVentura • 5/12/2025, 8:52:41 PM
Understanding how to draw proper trendlines is a fundamental skill for traders and analysts who want to identify market trends and make informed trading decisions. Trendlines help visualize the direction and strength of price movements, enabling traders to spot potential entry and exit points, confirm trend reversals, and manage risk effectively.
What Are Trendlines?
Trendlines are straight lines drawn on a price chart that connect two or more significant price points. They act as dynamic support or resistance levels, indicating the general direction of the price movement over time. There are two main types of trendlines:
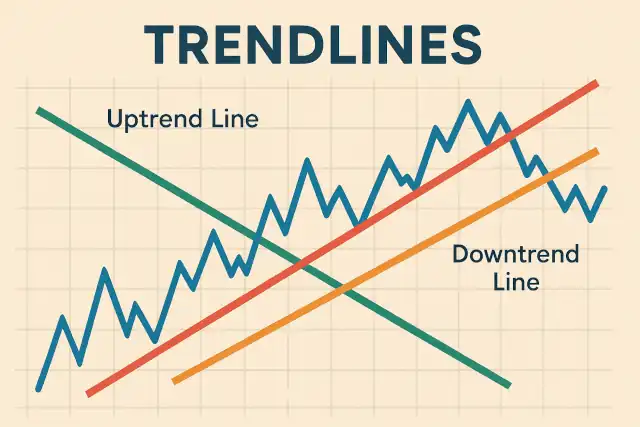
- Uptrend lines: Drawn by connecting a series of higher lows, indicating bullish momentum.
- Downtrend lines: Drawn by connecting a series of lower highs, indicating bearish momentum.
Properly drawn trendlines can help traders anticipate future price behavior based on historical patterns.
Step-by-Step Guide to Drawing Proper Trendlines
1. Choose the Right Chart and Timeframe
Start by selecting the appropriate chart type (candlestick, bar, or line chart) and timeframe that matches your trading style. For example, day traders might prefer 5-minute or 15-minute charts, while swing traders might focus on daily or weekly charts.
2. Identify Significant Price Points
Look for at least two or more significant pivot points where the price reverses direction. For an uptrend line, these are higher lows; for a downtrend line, these are lower highs. These points should be clearly visible and not just minor fluctuations.
3. Draw the Trendline
Use a straight line tool to connect the identified price points. For an uptrend, draw the line beneath the price action, touching the lows. For a downtrend, draw the line above the price action, touching the highs. The line should extend into the future to help predict potential support or resistance.
4. Validate the Trendline
A valid trendline should connect at least two points, but ideally three or more. The more points it touches without being broken, the stronger and more reliable the trendline is considered.
5. Adjust for Wicks and Bodies
Decide whether to use the candle wicks (highs and lows) or the candle bodies (open and close prices) when drawing your trendline. Using wicks captures the extremes of price movement, while bodies reflect where the majority of trading occurred. Some traders prefer to draw trendlines along the bodies for smoother lines.
6. Monitor Trendline Breaks
When price breaks through a trendline, it can signal a potential change in trend or momentum. Confirm the breakout with increased volume or other technical indicators before acting.
Tips for Drawing Effective Trendlines
- Be patient: Don’t force a trendline where none exists. Wait for clear pivot points.
- Use multiple timeframes: Confirm trendlines on higher timeframes for stronger signals.
- Combine with other indicators: Use moving averages, RSI, or MACD to validate trendline signals.
- Avoid overcomplicating: Simpler trendlines are often more effective than overly complex ones.
- Redraw as necessary: As new price data emerges, adjust your trendlines to maintain accuracy.
Common Mistakes to Avoid
- Connecting unrelated points: Trendlines should connect meaningful highs or lows, not random points.
- Ignoring false breakouts: Always confirm breakouts with volume or other indicators.
- Drawing trendlines on low volume: Price action on low volume can be misleading.
- Using trendlines in sideways markets: Trendlines are less effective in ranging markets.
Mathematical Representation of Trendlines
While trendlines are typically drawn visually, they can also be expressed mathematically. A trendline can be represented by the linear equation:
where:
- is the price level,
- is the time or bar index,
- is the slope of the trendline (rate of price change),
- is the intercept (price at time zero).
Calculating the slope between two points and is:
This allows algorithmic traders to automate trendline detection by finding lines that fit multiple pivot points within a specified tolerance.
Using Trendlines in Algorithmic Trading
In an algorithmic trading platform, trendlines can be programmatically identified by:
- Detecting significant highs and lows using peak-finding algorithms.
- Calculating the slope and intercept of potential trendlines.
- Validating trendlines by counting the number of points within a certain distance from the line.
- Monitoring for price breaks above or below the trendline to trigger trading signals.
By incorporating trendline analysis into your algorithms, you can enhance your system’s ability to recognize market trends and improve trade timing.
Conclusion
Drawing proper trendlines is a powerful technique to understand market direction and momentum. By carefully selecting pivot points, validating your lines, and combining them with other technical tools, you can enhance your trading analysis and decision-making process. Whether you are a manual trader or developing algorithmic strategies, mastering trendlines is essential for effective market analysis.