Understanding the Head and Shoulders Pattern in Algorithmic Trading
AndyVentura • 5/10/2025, 6:53:56 PM
Understanding the Head and Shoulders Pattern in Algorithmic Trading
The Head and Shoulders pattern is one of the most reliable and widely recognized chart patterns in technical analysis, especially valuable in algorithmic trading. This pattern helps traders identify potential trend reversals, allowing them to make informed decisions about entering or exiting trades. In this article, we will explore what the Head and Shoulders pattern is, how it forms, and how algorithmic traders can use it to enhance their trading strategies.
What is the Head and Shoulders Pattern?
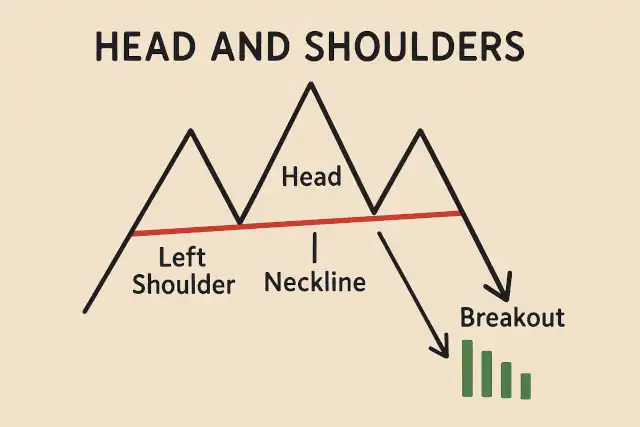
The Head and Shoulders pattern is a chart formation that signals a reversal in the current trend. It consists of three peaks:
- Left Shoulder: The first peak, followed by a decline.
- Head: A higher peak than the left shoulder, followed by another decline.
- Right Shoulder: A peak similar in height to the left shoulder, followed by a decline.
The pattern is completed by a “neckline,” which is drawn by connecting the lows following the left shoulder and the head. When the price breaks below the neckline after forming the right shoulder, it typically indicates a bearish reversal.
There is also an inverse version of this pattern, called the Inverse Head and Shoulders, which signals a potential bullish reversal in a downtrend.
Visualizing the Pattern
Here is a simplified representation of the Head and Shoulders pattern:
   Left Shoulder    Head       Right Shoulder
       /\           /\             /\
      /  \         /  \           /  \
-----    ---------    -----------    -----  <- Neckline
Mathematical Representation
In algorithmic trading, this pattern can be identified by analyzing price data points. Suppose represents the price at time . The pattern can be described by the following conditions:
-
There exist three local maxima at times such that:
-
The lows between these peaks, say at times and , define the neckline:
-
A breakout occurs when the price falls below the neckline after :
Importance in Algorithmic Trading
Algorithmic trading relies heavily on pattern recognition to automate buy and sell decisions. The Head and Shoulders pattern is particularly useful because it often signals a strong reversal, giving algorithms a predictive edge.
Entry and Exit Signals
- Entry Point: Algorithms can be programmed to enter a short position when the price breaks below the neckline after the right shoulder forms.
- Stop Loss: A stop loss can be placed just above the right shoulder to limit potential losses if the pattern fails.
- Profit Target: The expected price move after the breakout is often estimated by measuring the vertical distance from the head to the neckline, then projecting this distance downward from the breakout point.
Mathematically, if is the price at the head and is the price at the neckline breakout, the target price can be estimated as:
Backtesting and Implementation
Incorporating the Head and Shoulders pattern into an algorithmic trading strategy involves:
- Pattern Detection: Using peak detection algorithms and trendline fitting to identify the pattern in historical price data.
- Signal Generation: Coding the logic for entry, stop loss, and take profit based on the pattern’s breakout.
- Backtesting: Testing the strategy over historical data to evaluate performance, win rate, and risk metrics.
- Optimization: Adjusting parameters such as the time frame or neckline tolerance to improve results.
Challenges and Considerations
- False Breakouts: Sometimes the price may break the neckline but quickly reverse, leading to losses.
- Pattern Variability: The shoulders may not always be perfectly symmetrical, and the neckline may be sloped.
- Market Conditions: The pattern is more reliable in trending markets and less so in highly volatile or sideways markets.
Example Use Case
Consider a stock trading algorithm that monitors 1-hour candlestick data. The algorithm scans for the Head and Shoulders pattern by:
- Identifying local maxima and minima using a smoothing filter.
- Drawing the neckline and checking for price breakout.
- Executing a short sell order when the breakout is confirmed with volume support.
- Setting a stop loss above the right shoulder and a take profit based on the measured move.
Backtesting this strategy over the past year might reveal that it captures significant trend reversals with a favorable risk-to-reward ratio.
Conclusion
The Head and Shoulders pattern remains a cornerstone of technical analysis and is highly applicable in algorithmic trading. By automating the detection and execution based on this pattern, traders can capitalize on trend reversals with increased speed and discipline. However, like all trading tools, it should be used in conjunction with other indicators and risk management practices to maximize effectiveness.
Mastering this pattern equips algorithmic traders with a powerful method to anticipate market moves and improve their overall trading performance.