Understanding the Money Flow Index Indicator for Trading Success
AndyVentura • 5/11/2025, 3:13:48 PM
Understanding the Money Flow Index Indicator for Trading Success
The Money Flow Index (MFI) is a powerful technical indicator widely used by traders to gauge buying and selling pressure in the market. Unlike many traditional momentum indicators that only consider price data, the MFI incorporates both price and volume, making it a volume-weighted version of the Relative Strength Index (RSI). This dual consideration provides traders with a more comprehensive view of market sentiment and potential price reversals.
What is the Money Flow Index?
The Money Flow Index is a momentum oscillator that ranges between 0 and 100. It measures the strength of money flowing in and out of an asset over a specific period, typically 14 days. By analyzing the flow of money, traders can identify overbought or oversold conditions, helping them anticipate potential trend reversals or continuations.
How is the Money Flow Index Calculated?
The calculation of the MFI involves several steps:
-
Typical Price (TP): First, calculate the typical price for each period:
-
Raw Money Flow: Multiply the typical price by the volume for the period:
-
Money Flow Ratio: Separate the raw money flows into positive and negative based on whether the typical price has increased or decreased compared to the previous period. Then, calculate the ratio:
-
Money Flow Index: Finally, compute the MFI using the formula:
Interpreting the Money Flow Index
The MFI is interpreted similarly to other oscillators:
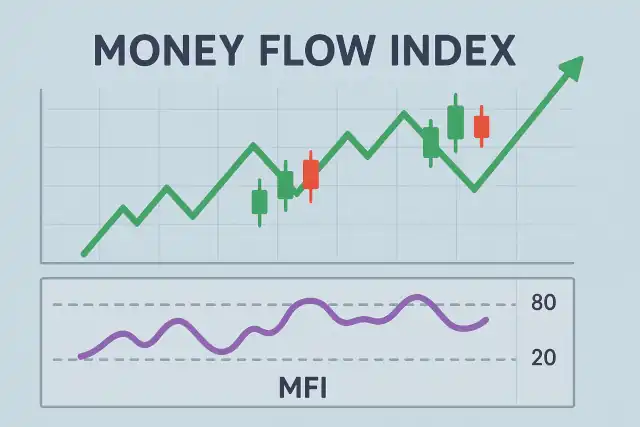
- Overbought Condition: When the MFI rises above 80, the asset may be overbought, suggesting a potential price reversal or pullback.
- Oversold Condition: When the MFI falls below 20, the asset may be oversold, indicating a possible buying opportunity.
- Divergences: Traders also look for divergences between the MFI and price. For example, if prices reach new highs but the MFI fails to do so, it may signal weakening buying pressure and a potential reversal.
Advantages of Using the Money Flow Index
- Volume Inclusion: By incorporating volume, the MFI provides better insight into the strength behind price movements.
- Early Signals: MFI often identifies reversals earlier than price-based indicators alone.
- Versatility: It works well across various asset classes, including stocks, forex, and commodities.
Limitations to Consider
- False Signals: Like all indicators, the MFI can produce false signals, especially in highly volatile or low-volume markets.
- Lagging Nature: Since it relies on historical data, the MFI may lag during sharp market moves.
Practical Tips for Algorithmic Trading
When integrating the Money Flow Index into algorithmic trading strategies, consider the following:
- Combine MFI signals with other technical indicators, such as moving averages or trend lines, to enhance reliability.
- Use adaptive period lengths based on the asset’s volatility to optimize sensitivity.
- Backtest strategies extensively to understand how the MFI performs under different market conditions.
Conclusion
The Money Flow Index is a valuable tool for traders seeking to understand the underlying buying and selling pressures driving price movements. By combining price and volume data, it offers nuanced insights into market dynamics that can improve decision-making. While no indicator is perfect, the MFI’s ability to highlight overbought and oversold conditions, as well as divergences, makes it an essential component of many algorithmic and manual trading strategies.