Ichimoku Cloud Indicator
AndyVentura • 4/30/2025, 6:01:11 AM
The Ichimoku Cloud, also known as Ichimoku Kinko Hyo, is a versatile and robust technical analysis indicator used to assess potential price movements and trends in financial markets. Created in the late 1930s by Goichi Hosoda, a Japanese journalist, the Ichimoku Cloud combines various components to provide traders with an all-in-one indicator that highlights support and resistance levels, trend direction, and momentum. This makes it particularly popular among forex, stock, and cryptocurrency traders looking for a comprehensive tool to streamline their analysis.
What Is the Ichimoku Cloud Indicator?
The term “Ichimoku Kinko Hyo” roughly translates as “one glance equilibrium chart.” True to its name, the indicator is designed to give traders a clear and immediate insight into the market’s overall condition. It achieves this by generating a “cloud,” or “Kumo,” which visually represents areas of potential support and resistance, while also helping to identify prominent trends.
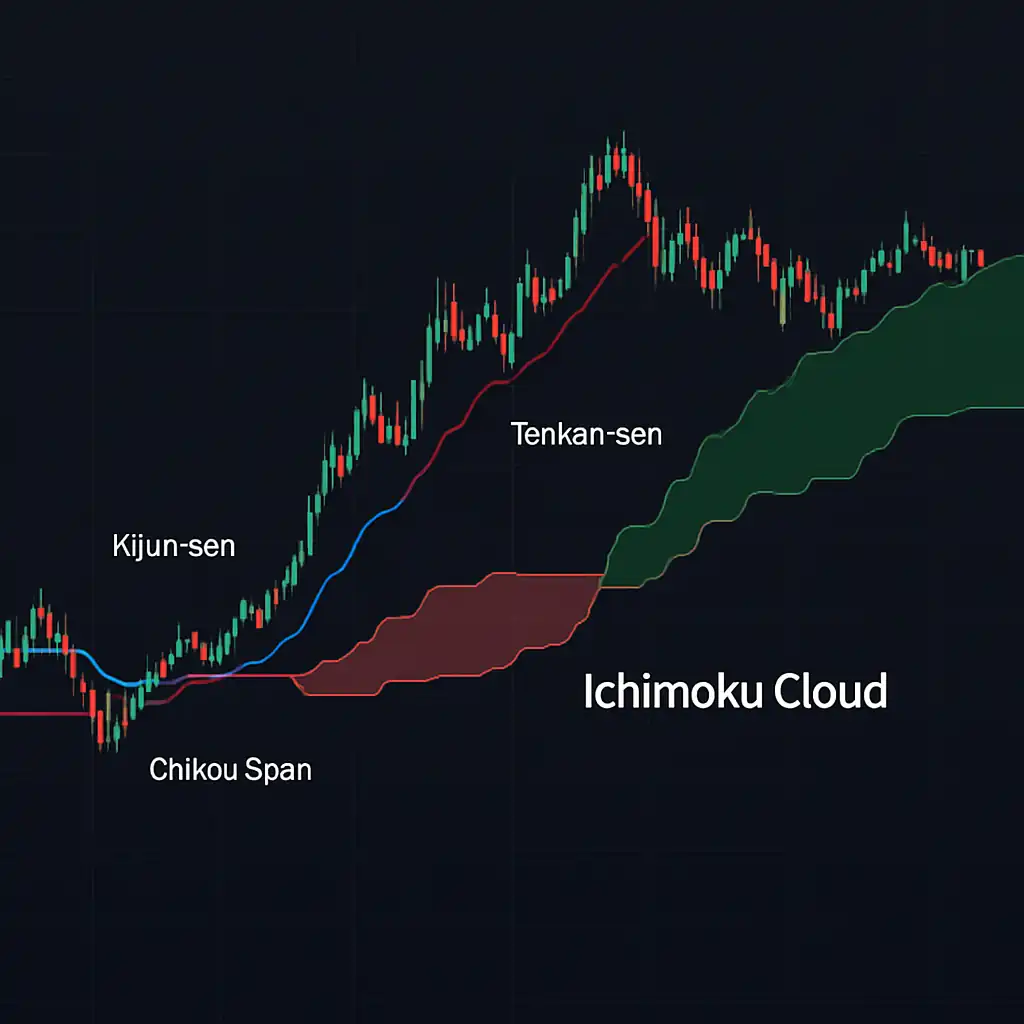
The Ichimoku Cloud goes beyond typical indicators by providing multiple data points simultaneously, including price momentum, trend strength, and key areas of interest over time. It is composed of five lines or calculations that interact to create the indicator:
- Tenkan-sen (Conversion Line): The midpoint of the highest high and lowest low over the past 9 periods.
- Kijun-sen (Base Line): The midpoint of the highest high and lowest low over the previous 26 periods.
- Senkou Span A (Leading Span A): The average of the Tenkan-sen and Kijun-sen, projected 26 periods into the future.
- Senkou Span B (Leading Span B): The midpoint of the highest high and lowest low over the past 52 periods, also projected 26 periods into the future.
- Chikou Span (Lagging Span): The current period’s closing price, plotted 26 periods into the past.
These calculations work together to generate the central components of the Ichimoku Cloud.
The Cloud (Kumo)
The “cloud” is formed by the space between Senkou Span A and Senkou Span B, and it plays a central role in the indicator’s interpretation. When the price is above the cloud, the trend is considered bullish, while prices below the cloud signal a bearish trend. If the price is inside the cloud, it may indicate a period of consolidation or indecision in the market.
The thickness of the cloud can also reveal information about the strength of support or resistance. A thick cloud suggests strong resistance or support, while a thinner cloud may represent weaker levels.
Key Interpretation and Benefits
The Ichimoku Cloud offers distinct advantages to traders due to its multifunctional nature. Here’s how it is commonly interpreted:
-
Trend Identification:
The Ichimoku Cloud is primarily used to identify trends. If the price is above the cloud, the market is considered to be in an uptrend. Conversely, if the price is below the cloud, the market is in a downtrend. When the price moves through the cloud, it may signal a reversal or a breakout. -
Support and Resistance Levels:
The cloud itself acts as a zone of dynamic support (below the price) or resistance (above the price). Many traders use these areas to plan strategic entry or exit points. -
Momentum Assessment:
The Tenkan-sen and Kijun-sen crossings act as momentum indicators. A bullish signal occurs when the Tenkan-sen crosses above the Kijun-sen, while a bearish signal occurs when it crosses below. -
Historical Context:
The Chikou Span helps to compare current price movements against historical price levels, offering additional context to support decision-making. -
Looking Ahead (Future Indicators):
The projection of the cloud into the future, via the Senkou Spans, aids traders in anticipating potential support and resistance zones before the price reaches them.
Benefits of Using the Ichimoku Cloud
- Comprehensive View: The Ichimoku Cloud provides a holistic, single-chart view of market trends, support, resistance levels, and momentum.
- Customization: The default periods (9, 26, 52) can be adjusted to suit the trader’s timeframe or specific market conditions.
- Backward- and Forward-Looking Analysis: By plotting key components in both past and future periods, the Ichimoku Cloud gives traders unique insights for planning trades.
- Effective in Multiple Markets: The indicator is versatile and can be applied to different markets and asset classes, including forex, stocks, and cryptocurrencies.
Potential Limitations
While the Ichimoku Cloud is a powerful tool, it is not without its challenges:
-
Complexity for Beginners:
New traders may find the multiple components and the interactions between them overwhelming. -
Delay in Signals:
Like many technical indicators, the Ichimoku Cloud can lag in fast-moving markets. This could result in missed entry or exit opportunities. -
Interpretation in Sideways Markets:
The indicator is most effective in trending markets. In a range-bound or choppy market, it may produce false signals.
Conclusion
The Ichimoku Cloud Indicator is a versatile and multifunctional tool that can enhance a trader’s ability to identify trends, assess momentum, and locate key areas of support and resistance. While it comes with a learning curve, its all-encompassing nature saves time and provides traders with a clearer picture of market behavior. Understanding how to analyze and interpret the components of the Ichimoku Cloud can lead to more informed and strategic trading decisions.
For traders looking for a comprehensive indicator to guide their market analysis at a glance, the Ichimoku Cloud stands as an invaluable resource. However, as with any technical indicator, it is best used in combination with other tools and strategies to confirm signals and improve accuracy.